FrozenLake with Stochastic Double Q-Learning
In this notebook we solve a non-slippery version of the FrozenLake-v0 environment using value-based control with double q-learning bootstrap targets.
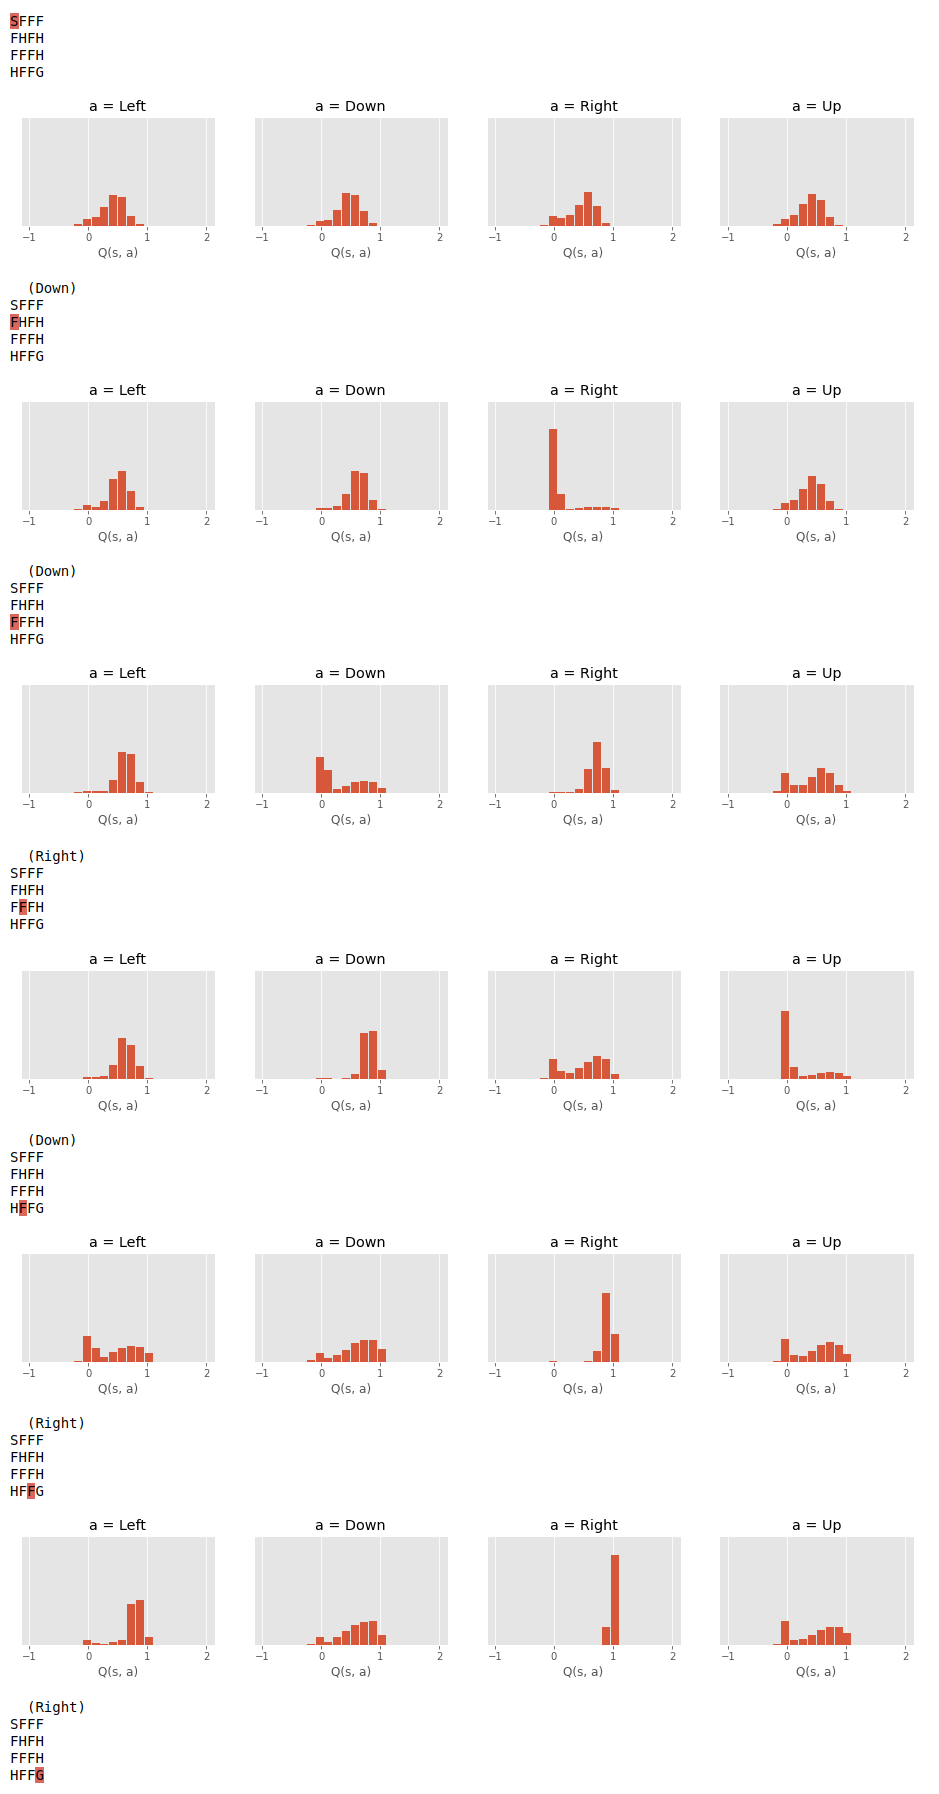
Instead of learning a point estimate for the expected return, we learn the distribution over all possible returns. This approach is known as Distributional RL, see paper.
We’ll use a linear function approximator for our learned distribution. Since the observation space is discrete, this is equivalent to the table-lookup case.
Scroll down to see the plots generated by this script.
stochastic_double_qlearning.py
import coax
import gymnasium
import jax
import jax.numpy as jnp
import haiku as hk
import optax
from matplotlib import pyplot as plt


# the MDP
env = gymnasium.make('FrozenLakeNonSlippery-v0')
env = coax.wrappers.TrainMonitor(env)


def func(S, A, is_training):
    logits = hk.Sequential((hk.Flatten(), hk.Linear(20, w_init=jnp.zeros)))
    X = jax.vmap(jnp.kron)(S, A)  # S and A are one-hot encoded
    return {'logits': logits(X)}


# function approximator
q = coax.StochasticQ(func, env, value_range=(-1, 2), num_bins=20)
pi = coax.BoltzmannPolicy(q, temperature=0.1)


# target network
q_targ = q.copy()


# experience tracer
tracer = coax.reward_tracing.NStep(n=1, gamma=0.9)


# updater
qlearning = coax.td_learning.DoubleQLearning(q, q_targ=q_targ, optimizer=optax.adam(0.02))


# train
for ep in range(500):
    s, info = env.reset()

    for t in range(env.spec.max_episode_steps):
        a = pi(s)
        s_next, r, done, truncated, info = env.step(a)

        # small incentive to keep moving
        if jnp.array_equal(s_next, s):
            r = -0.01

        # update
        tracer.add(s, a, r, done or truncated)
        while tracer:
            transition_batch = tracer.pop()
            qlearning.update(transition_batch)

            # sync target network
            q_targ.soft_update(q, tau=0.1)

        if done or truncated:
            break

        s = s_next

    # early stopping
    if env.avg_G > env.spec.reward_threshold:
        break


# run env one more time to render
s, info = env.reset()
env.render()

for t in range(env.spec.max_episode_steps):

    # create sub-plots, one for each action
    fig, axes = plt.subplots(nrows=1, ncols=4, figsize=(16, 2))
    action_names = ('Left', 'Down', 'Right', 'Up')

    for action_name, ax, dist_params in zip(action_names, axes, q.dist_params(s)):
        p = jax.nn.softmax(dist_params['logits'])
        z = q.proba_dist.atoms

        # plot histogram for this specific state-action pair
        ax.bar(z, p, width=(z[1] - z[0]) * 0.9)
        ax.set_title(f"a = {action_name}")
        ax.set_ylim(0, 1)
        ax.set_xlabel('Q(s, a)')
        ax.set_yticks([])

    plt.show()

    a = pi.mode(s)
    s, r, done, truncated, info = env.step(a)

    env.render()

    if done or truncated:
        break


if env.avg_G < env.spec.reward_threshold:
    name = globals().get('__file__', 'this script')
    raise RuntimeError(f"{name} failed to reach env.spec.reward_threshold")